Understanding the Seven Food and Beverage Industry Metrics That Matter Most
Tuesday, July 14, 2026
Short on Time? Here Are the Key Takeaways:
Accurate, timely metrics let you calculate and maximize ROI across efficiency, inventory, revenue, and revenue leakage.
Yield by location, line and shift allows you to measure how efficiently raw materials become finished products across facilities, exposing gaps and opportunities.
Quantity produced by time period and product variety helps you track production volume by item and timeframe to reveal variability and support forecasting.
Expected vs. actual cost by output item shows you product-level margins, highlighting cost deviations and areas for improvement.
Over/under consumption by production order lets you compare actual material use to recipes to uncover waste and inefficiencies.
Quantity produced by month, units vs. net weight ties production volume to product composition for better logistics and capacity planning.
On-time, in-full (OTIF) shipping performance helps you monitor order fulfillment accuracy across production, inventory and logistics.
Cost per delivery enables you to evaluate transportation spend per order to expose inefficiencies and optimize routes.
An industry-specific ERP on an AI-powered platform centralizes production, inventory, cost, and transportation data to track metrics and drive improvement.

By Jack Payne| Vice President, Product Management & Solutions Consulting
Featured in this post

If you're an operations manager at a food and beverage business, your role is a hungry one in terms of the demands that must be met. You’re juggling tight schedules, perishable ingredients, complex manufacturing processes and numerous variables you can’t always control. You need an effective means of monitoring everything that’s going on, because it’s way too much for one person to keep track of, and you’ve got enough on your plate.
Accurate real-time data is the answer. You’ll need it to calculate the key performance indicators (KPIs) for the food industry that really matter. Having your finger on the pulse of your operations via the right metrics allows you to be proactive and drive improvement, critical if your organization is going to grow and thrive.
But your real challenge isn’t access to data, seeing as how you've likely already got an enterprise resource planning (ERP) system (and possibly other tools) generating more data than your team can realistically act on. What you really need is to know which numbers actually matter and how you can most easily get them moving in the right direction.
That's where artificial intelligence (AI) comes in. An AI-powered platform can collate data across your systems, surface the insights that deserve your attention and flag anomalies before they become costly problems. So while your ERP remains your system of record, AI helps you get ahead of tomorrow.
In this blog post, we’ll explain why a strong, connected data foundation is the fastest path to fewer surprises, better decisions and continuous improvement across your entire operation, not to mention critical for calculating return on investment (ROI). Then, we’ll walk you through the seven food and beverage industry metrics that you should prioritize, separating those that matter from the many we know you’re inundated with each day.
Along the way, we’ll discuss how modern ERP platforms with built-in AI and end-to-end integration make KPIs easier to track, trust and act on—no spreadsheets or bolt-ons required.
Why You Need Better Data: How Measuring KPIs for the Food and Beverage Industry Enables Maximization of ROI
Bottom line: If you want to improve the performance of your food and beverage operations, you need better data. Clear, reliable and timely metrics give you the insight to make smarter decisions and drive measurable results. And with good data, you can effectively measure and maximize your ROI in its four forms: greater efficiency, better inventory management, increased revenue and reduced revenue leakage.
Of course, none of these forms of ROI can be captured in a single number. They are each the composite of multiple contributing factors, which means that to quantify them you need to track a set of related metrics and understand how they work together. That’s why it’s helpful to break each one down and look at the specific KPIs that factor into its overall impact:
Greater efficiency – Beyond just production speed, efficiency is about everyone (from individuals to departments) and everything (from singular machines to entire facilities) performing their tasks in a streamlined way. By ensuring that everyone has access to accurate, real-time information, you can eliminate redundancies and reduce confusion, allowing all employees to make the most of their time. Meanwhile, regular recalibration and maintenance of your manufacturing equipment helps keep your assets at peak performance and reduces unexpected downtime due to emergency repairs. Metrics to track include overall equipment effectiveness (OEE), machine downtime, production cycle time and labor utilization.
Better inventory management – Effective inventory management protects margins and reduces waste. Tracking shelf life, yield and raw material consumption helps prevent spoilage and other forms of waste. Accurate forecasting and supplier collaboration can lower material costs and ensure you’re using resources optimally. Metrics to track include over/under consumption by production order, inventory turnover, yield by location and days of inventory on hand.
Increased revenue – Growth comes from fulfilling orders on time and in full while optimizing production and capacity. High service levels and repeat business directly boost the bottom line. Metrics to track include quantity produced by brand and period, order fulfillment rates, customer service KPIs and on-time, in-full (OTIF) delivery percentages.
Reduced revenue leakage – By avoiding unnecessary costs from penalties, returns and overpayments, you can increase profitability. Reducing errors in shipments, promotions and reimbursements ensures you keep more of your revenue. Lastly, spoilage from poor shelf life management and giveaway from overfill can quietly erode margins before a unit ever leaves the plant. Metrics to track include post-invoice adjustments, late shipments, returns/rework, manufacturing losses and scrap rate.
Tracking individual metrics to quantify efficiency, inventory, revenue and revenue leakage isn’t just a theoretical exercise—it’s how you get a handle on the levers that most directly affect your margins. By monitoring the right metrics for the food and beverage industry, you can see where processes are working, where resources are being wasted and where revenue opportunities are slipping through the cracks.
A modern ERP solution with built-in analytics and/or business intelligence (BI) is a strong foundation for good data visibility and accessibility, but now AI takes that clarity a step further. With today’s technology, you can track KPIs for the food and beverage industry in real time, uncover patterns and act on insights before small issues turn into big problems—all in a timely manner, without cumbersome, manual processes. And with a single platform that integrates all of your solutions, you’ve got a unified view with no gaps or silos, enabling you to turn raw data into actionable intelligence that your staff can trust.
Now, let’s move on to the seven food and beverage industry metrics that matter most and how you can track them to drive improvement.
1. Yield by Location, Line and Shift
Yield is one of the clearest food manufacturing KPIs for understanding how efficiently raw materials are being converted into finished product. Looking at yield by location, production line and shift adds additional layers of insight, showing how consistently your production processes perform across different plants, lines and crews. When multiple the same item is being produced with different setups, meaningful differences in yield can result from variations in execution and/or equipment performance that deserve closer attention.
What To Look For
Differences in scale, product mix or facility layout can all influence yield, so make sure to account for them. What matters more are the gaps that can’t be easily explained. Persistently lower yield at one location often signals overfill or scrap, making inventory management more challenging and contributing to revenue leakage. By tracking this metric closely, your production leaders can spot potential issues and investigate root causes.
Applying Technology Optimally
To measure and improve yield by location, line and shift, technology is essential. Your best means for tracking inputs and outputs across facilities is ERP software that integrates production, inventory and quality assurance data. And when that data is captured automatically through connected equipment and analyzed by industry-specific AI, teams can more quickly identify outliers and replicate best practices to drive continuous improvement.
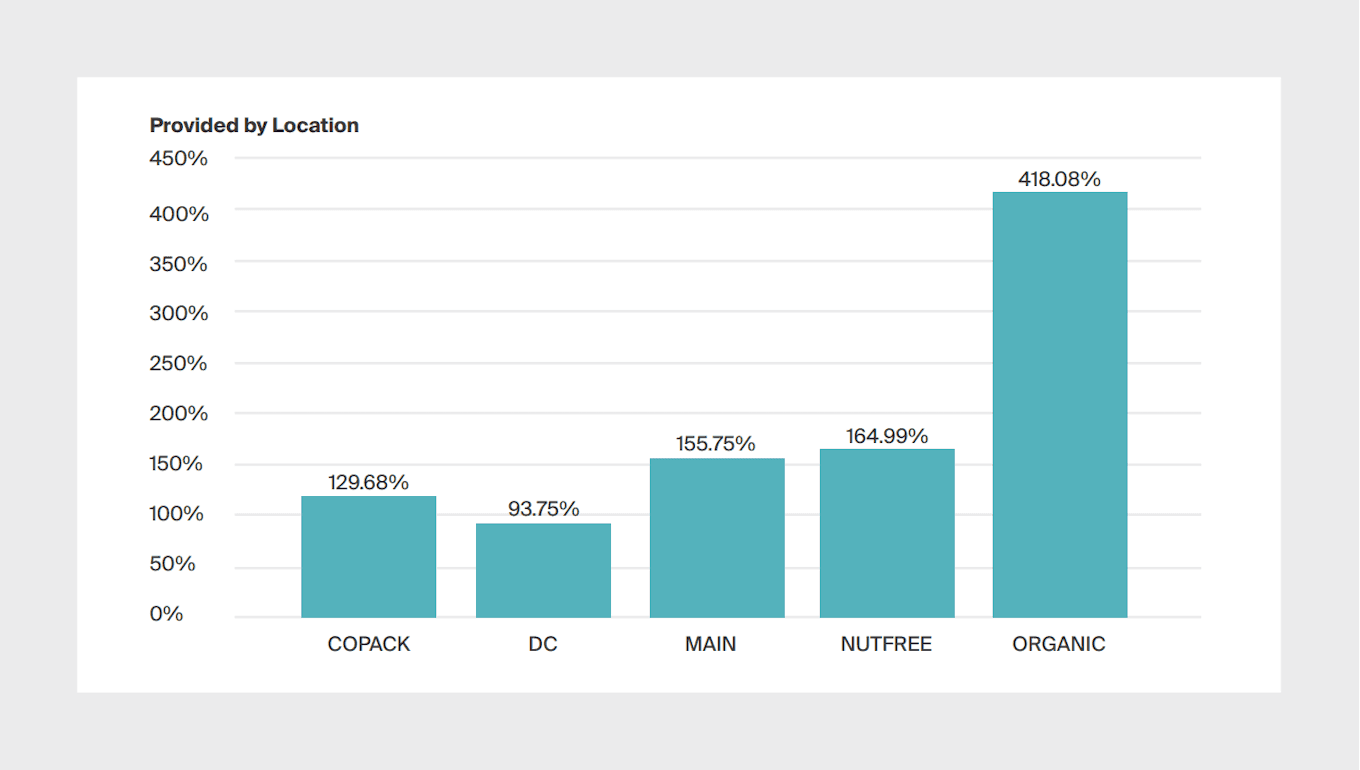
Figure: Yield by location
2. Quantity Produced by Time Period and Product Variety
How it’s visualized: Line graph with filters
Quantity produced by time period and product variety gives you a clear view into what your business is making and when. By tracking production volumes across different items and timeframes—daily, weekly, monthly or quarterly—you can quickly see which products are performing as expected and which ones are contributing to variability into your operations.
What To Look For
Of course, variability isn’t necessarily a problem—it’s an opportunity. Seasonality, promotions and shifting demand all show up in this metric. The issue is unexplained swings. Sudden drops in production volume often point to upstream problems like material shortages or scheduling misalignment, while downstream issues like excess inventory or constrained warehouse capacity point back are caused by spikes. When you can see these patterns early, you can adjust production plans and inventory levels before there’s an issue.
Applying Technology Optimally
An ERP system that integrates production, inventory and demand data creates a single source of truth for output by brand and time period. With AI-driven analytics, these systems can identify patterns, catch deviations and improve future forecasts. Instead of reacting to last month’s numbers, you’re using real-time, data-driven insights to improve inventory management and align output with demand to generate revenue.
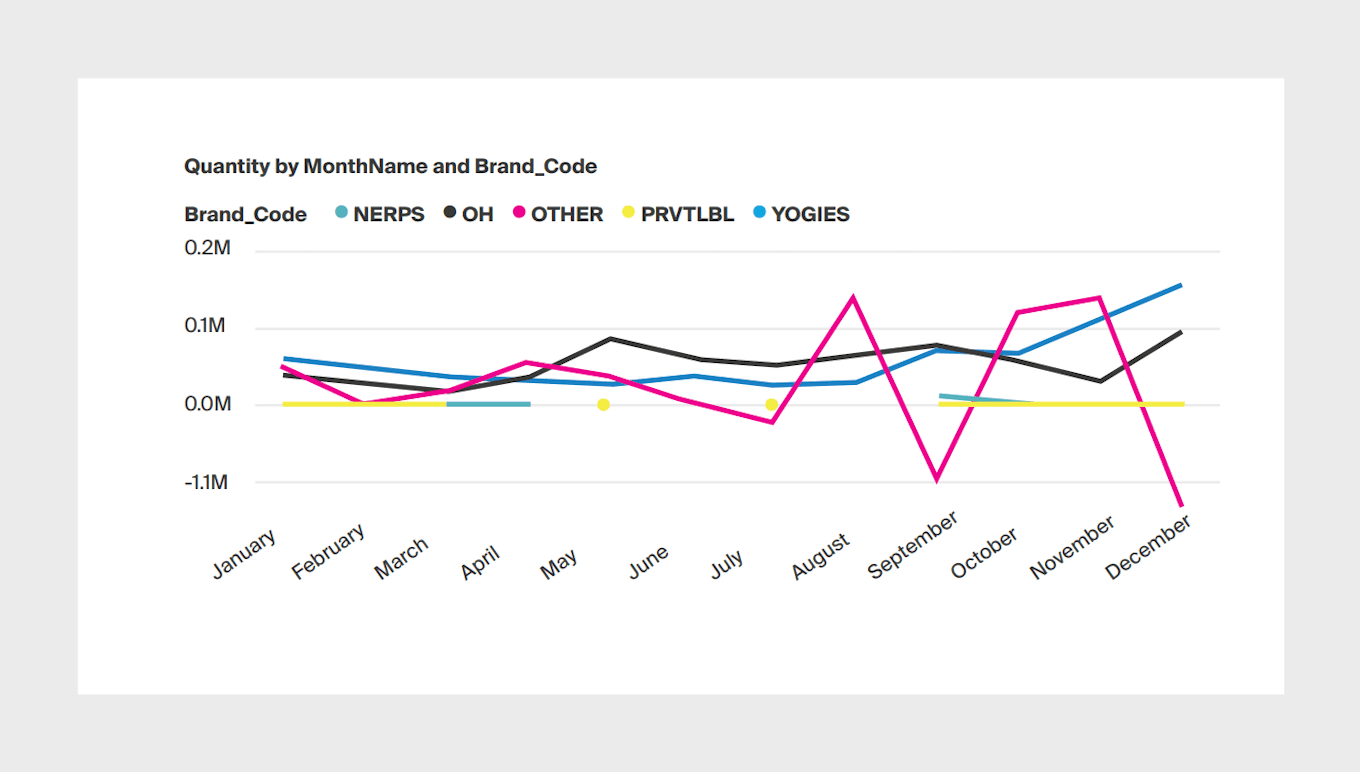
Figure: Quantity produced by time period and brand
3. Expected vs. Actual Cost by Output Item
How it’s visualized: Line graph comparing expected vs. actual cost by item over time
To measure how closely your real production costs align with what you planned and forecasted, you need to calculate the expected vs. actual cost by output item. Of the many KPIs for food manufacturers, this one does the best job of showing which individual products are performing at the margins you expect or drifting in the wrong direction. And because it operates at the item level, it’s especially useful for pinpointing cost issues otherwise concealed by averages or rolled-up financial reports.
What To Look For
Changes in costs for ingredients and labor can be expected and must be factored into your measurements. You’re looking for consistent gaps between expected and actual costs. When those gaps occur consistently, they often point to issues like inaccurate recipes or process inefficiencies. Because these variances accumulate over time, they can have a meaningful impact on profitability long before they show in financial reports.
Applying Technology Optimally
Tracking this metric effectively requires tight integration between production, inventory and costing data. Your ERP provides the foundation by tying actual material usage and labor back to each output item. Then you can apply AI analysis to make patterns easier to spot, cost drivers clearer to isolate and forecasts more accurate over time. That helps your teams protect margins and make better decisions about pricing, sourcing and production strategy.
4. Over/Under Consumption by Production Order
How it’s visualized: Comparison chart or table by production order
Over- or under-consumption by production order looks at how much raw material was actually used compared to what the recipe called for. A production order that hits its recipe exactly lands at 100% consumption. Anything above that indicates excess usage, while anything below suggests higher-than-expected yield. Either way, this is among the best food manufacturing metrics to track for a precise, order-level view into how closely reality matches your production assumptions.
What To Look For
Occasional deviations can happen for legitimate reasons, but repeated overconsumption often points to issues like overfill and rework. Consistent underconsumption, on the other hand, may signal that your recipes are outdated or overly conservative. Over time, both scenarios distort costing, complicate inventory management and make forecasting less reliable. Patterns begin to emerge when consumption is analyzed across many production orders, revealing to you which products are pushing margins higher or lower.
Applying Technology Optimally
Capturing this level of detail requires tight integration between production and inventory tracking. An ERP system records actual material usage at the production order level, creating a reliable baseline for comparison. When AI-powered analytics are applied, those results can be analyzed at scale to highlight recurring deviations, identify root causes and support continuous improvement efforts that reduce waste and protect profitability.
5. Quantity Produced by Month, Units vs. Net Weight
How it’s visualized: Line and stacked bar graph with filters
For a solid understanding of not just how much you’re producing but also what that production looks like in physical terms, you should scrutinize quantity produced by month, measured in units compared to net weight. This helps you get a clearer picture of the average size and composition of your products—which is especially important in food manufacturing, where variability in weight has a direct impact on storage, handling and distribution.
What To Look For
Intentional changes in product mix, packaging or portion size can cause gradual shifts in this metric, so some should be expected. Abrupt or unexplained changes, however, can cause disruption and thus are better avoided. Heavier average units can strain warehouse capacity and complicate transportation planning, while lighter units may point to yield issues or an overcorrection on overfill. Because these effects ripple beyond the production floor, this metric connects manufacturing decisions to logistics performance.
Applying Technology Optimally
Because it touches production, warehousing and transportation, tracking this KPI requires a shared view of data across teams. A unified platform that connects ERP, logistics, warehousing and supply chain data creates that alignment by making unit and weight information visible across departments. AI for the food industry can then help interpret changes over time, making it easier to anticipate capacity issues, transportation constraints and planning adjustments before they affect service levels.
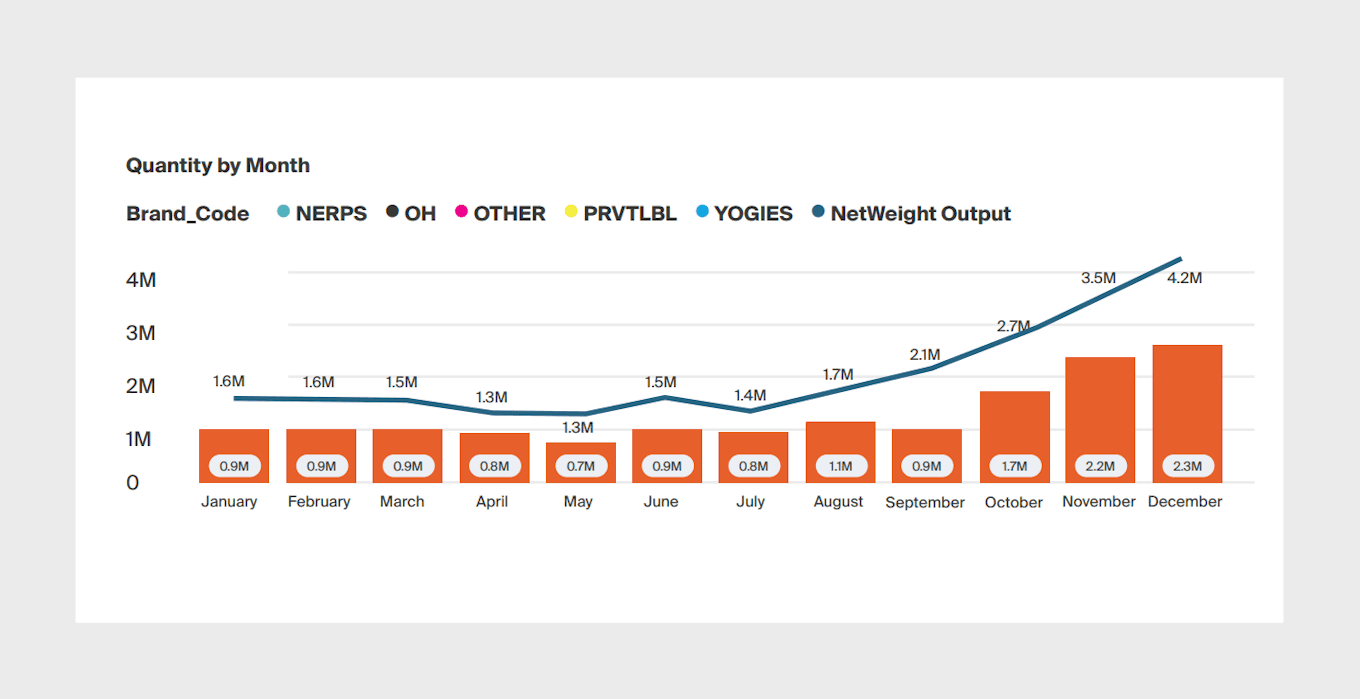
Figure: Quantity produced by month, units vs. net weight
6. On-Time, In-Full (OTIF) Performance
How it’s visualized: Percentage trend line over time with breakdowns by customer or lane
On-time, in-full (OTIF) performance measures how consistently customer orders are delivered when promised and in the quantities expected. It’s one of the most important key performance indicators for the food industry because it reflects the combined effectiveness of production, inventory management, execution and transportation.
What To Look For
OTIF issues rarely originate in a single place. Late or incomplete deliveries often trace back to upstream challenges like production delays, inaccurate inventory data or poor demand planning. At the same time, execution breakdowns—inefficient load building, missed delivery windows or suboptimal routing—can undo otherwise effective operations. When OTIF slips, it’s telling you that something in the end-to-end process is out of sync.
Applying Technology Optimally
This is where route optimization software becomes essential. When tightly integrated with ERP, routing solutions use real-time order, inventory and logistics data to build smarter routes and adjust plans as conditions change. Enabling the system with AI further improves performance, helping you balance service requirements with cost and capacity constraints. Your business benefits with higher service levels, fewer penalties and a measurable reduction in revenue leakage.
7. Cost per Delivery
How it’s visualized: Cost trend line by delivery with filters
Tracking how much it actually costs to get an order from your facility to the customer’s door—that is, your cost per delivery—is an invaluable practice. It rolls up transportation expenses like fuel, labor, carrier fees and accessorial charges into a single, easy-to-understand metric, and it can be a critical lens into how efficiently your business is executing after production is complete.
What To Look For
This KPI for the food industry is especially useful when viewed in context. Rising cost per delivery can indicate low route density, inefficient order allocation or an increasing reliance on expedited shipments. In some cases, it exposes a mismatch between order patterns and delivery strategies, such as shipping too frequently in small quantities or serving low-margin customers with high-cost routes. Thus, an excessive cost per delivery can undermine the gains made on the production floor.
Applying Technology Optimally
If your business runs its own distribution fleet, you’ll ideally measure and drive improvement of this metric with a route optimization solution. If on the other hand you use carriers to fulfill orders, you’ll want to consider a transportation management system (TMS). Both of these solutions provide visibility into delivery costs by route, customer and region. Route optimization software gives you tools to reduce miles driven and improve stop density, whereas a TMS lets you shop for the best rates given your company’s needs from a huge variety of carriers.
From there, you can integrate your routing software and/or TMS with ERP and AI-driven analytics to model scenarios according to your constraints and evaluate trade-offs. That enables you to adjust delivery strategies proactively to lower your spend and make costs more predictable.
What Are Some Other KPIs for Food Businesses to Consider?
Not every metric deserves equal weight. The goal isn’t to measure everything—it’s to measure what actually drives performance for your food and beverage company. That means choosing KPIs that reflect how your operation runs day to day, where variability creeps in and where there’s real opportunity to improve in a way that makes a material monetary difference.
With that in mind, here are several additional food and beverage industry metrics worth considering along with those you're already measuring.
Quantity Produced by Location, Line and Shift - Compare output across facilities to forecast future production and identify which plants are consistently performing well.
Number of Production Orders by Month - Understand how busy each month truly was and where planned production didn’t align with actual execution.
Production Orders by Machine and Line - Evaluate equipment utilization relative to capacity so you can spot constraints, imbalance and bottlenecks.
Number of Production Orders and Output Quantity by Day - Expose day-to-day variability in production and uncover what's creating those inconsistencies.
Output Quantity by Machine Center and Year - Analyze long-term asset utilization to support better maintenance planning and production strategy.
Cost by Location - Identify cost variability across facilities to pinpoint where process changes or standardization could yield savings.
Scrap and Rework Rate - Track materials lost to spoilage and defects to determine where quality issues lie and what their impact on yield and profitability is.
Together, these KPIs for the food and beverage industry help round out your view of production performance, revealing where output, cost and consistency diverge—and where targeted improvements can deliver meaningful ROI.
See Your Entire Food Business Clearly
If you're already tracking some of these KPIs, you've taken some prudent initial steps in the right direction. But knowing what to prioritize and having the tools to surface those insights quickly is what separates teams that monitor performance and teams that drive it. From yield and production volume to cost control and delivery performance, these metrics work best when they’re trusted and actionable, and technology is the best means of tracking them.
Of course, while digital transformation is well underway across the food and beverage industry, no two companies are in the same place. Every business moves toward digital maturity at its own pace. If you want to accelerate, you’ll want to find a technology partner with deep food industry expertise and a platform that can meet you where you are today and scale over time.
You’ll probably come across our name if you search online or ask AI for potential providers of software and AI in the food industry. That’s because our offering, Aptean Food & Beverage ERP, is developed with decades of industry experience and equipped with the latest purpose-built functionality.
Its new home is AppCentral, a unified, AI-powered platform that acts as a single pane of glass from which you can review and manage your entire business end-to-end. By connecting all your systems—ERP, transportation, maintenance and more—and enhancing them with Aptean Intelligence, your team can ask questions to get instant answers, automate processes to save time and act with confidence from their role-based AI workspaces, equipped with the tools and data they need.
Aptean Food & Beverage ERP is already trusted by thousands of customers around the world, and they’ve seen how our software drives process improvement and makes a meaningful difference for the bottom line. And now that it’s on AppCentral, your Aptean technology grows with your business, keeping you prepared for any challenge.
Want to explore Aptean's solutions further? Take a product tour of Aptean Food & Beverage ERP and/or AppCentral, request a personalized demo and reach out with any questions.
The Second Edition of Jack Payne’s Appetite for Success: Thriving With Technology in the Food and Beverage Industry is available now. Get the latest insights on technology ROI, AI and unified enterprise platforms.
With more than 30 years of food and beverage industry experience, Jack is a seasoned expert in helping manufacturers, processors and distributors solve complex operational challenges with technology—he even wrote the book on it. With deep expertise in enterprise resource planning (ERP), supply chain optimization and regulatory compliance, Jack is passionate about helping companies drive efficiency, traceability and growth through purpose-built software.
At Aptean, Jack collaborates closely with product, sales and customer teams to align technology innovation with real-world business needs—especially in highly regulated and fast-moving industries. A frequent speaker at industry events and contributor to trade publications, Jack is known for his clear-eyed insights, practical advice and deep understanding of what it takes to succeed in the food and beverage industry.
From family-owned bakeries to global beverage brands, Jack brings valuable perspective to businesses of all sizes and specialties. His insights draw from decades of hands-on experience across sectors like dairy, produce and packaged goods.
By Jack Payne| Vice President, Product Management & Solutions Consulting
Related Content

A Practical Guide to Building Your Business Case for Food Manufacturing Software
In this practical guide, we show you what you’ll need to include in a comprehensive business case to gain leadership buy-in for your next food software project.
Succeeding in Food Supply Chain Management with Specialized Solutions
The answer is surprisingly simple: equip your business with the right tech. Read on to discover how specialized ERP and TMS solutions can optimize your supply chain.

The Top 3 Areas of Focus for Increasing Profitability in the Food and Beverage Industry
With tight margins and rising costs, it’s never been more important to maximize profitability in your food manufacturing business. Here’s how to go about it.
The Top 6 Challenges in Food Warehouse Management and How Purpose-Built Software Solves Them
Food warehouse management is a minefield of moving parts and tricky challenges which is why you need purpose-built software to smooth the process.
Master Yield Management in Food Production: 10 Steps To Competitive Advantage
Use this guide to move beyond traditional methods of yield analysis and embrace a scientific approach that can help increase efficiency and boost your revenue.